Where the animation is made interactive, this allows the audience to engage with the explanations, 'ask questions of it' and test out their own hypotheses or questions about how things might change in a particular situation.
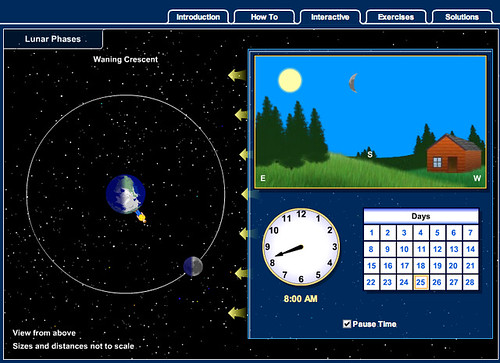
For example, the following screenshot is taken from an interactive application that demonstrates how the different phases of the moon appear to come about:

You can try out the interactive animation here: Astronomy: Journey to the Cosmic Frontier (Mcgraw-Hill) interactive: "Lunar Phases Interactive".
Even though no textual explanation is given about how the different phases of the moon appear to us on earth, do you think you could provide an explanation of the effect simply based on the above graphic? What explanation do you think the image provides, and how does the graphic manage to communicate it? Do the elements of animation and/or interactivity help to explain the effect 'in more detail', and if so, how?
No comments:
Post a Comment