This actually makes reference to a mathematical structure known as a graph, a network like structure that describes how sets of points (more correctly referred to as nodes) are connected to other points (i.e. other nodes) by edges that describe some relationship (or relation) between them.
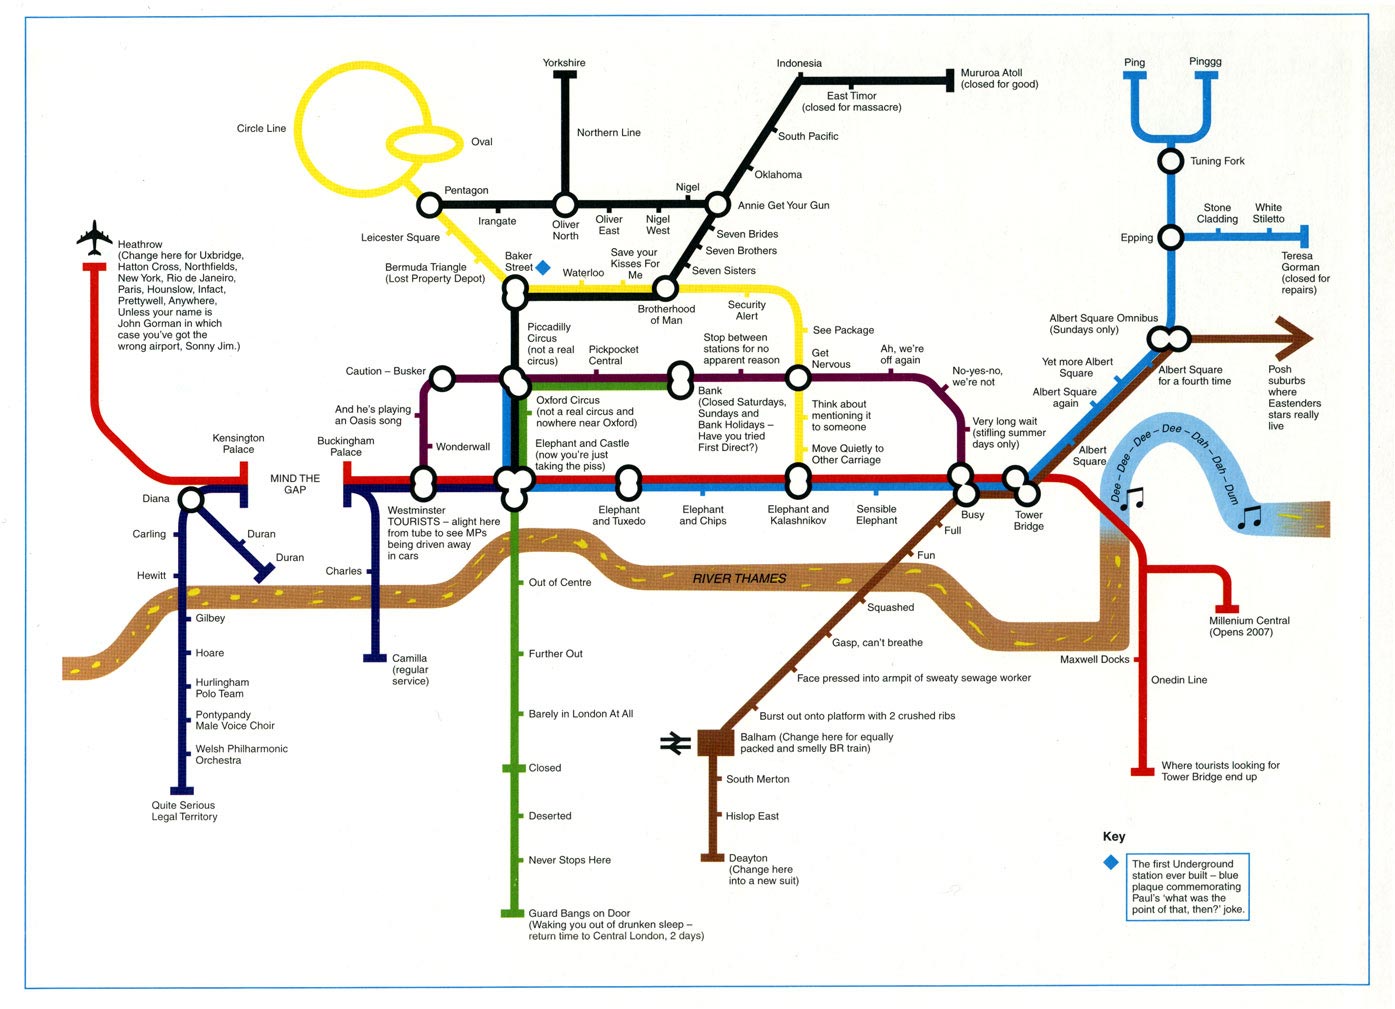
One of the most widely know graphs is the graph of the London Underground (which also just happens to be a topological map - that is, a map with all the superfluous information (relative to the task at hand) removed from it:

As with the Periodic Table of Chemical Elements, so recognisable is this visual representation and the 'visual literacy' conventions it has established, that its design ideas have been widely adopted elsewhere.
Here are a couple of amusing examples I have found:
See if you can find examples of other maps or visualisations that resemble the style London Underground map (the websites for other major transit systems are a good place to start). Link back to any examples you find with a comment to this post.
The 'fluidity' of the topographical map - the nodal points (e.g. the tube stations on the London Underground map) can 'move around' the map to a position where they 'look right', rather than having to necessarily conform to their exact geographical location. (For example, here is a 'true' map of the London Underground that does respect geography: 'true' map of the London Underground; and here's a 'real' London Tube Map overlaid on a map of London.).
The topological nature of the London Tube map means that it can be 'reflowed' or 'transformed' to provide a focus + context display representation (as used in hyperbolic tree displays, for example), to provide a view of the map centred around any particular tube station.
As an example of a such a focus + context display, one enterprising designer has constructed an interactive tube map, with any tube station at the centre, that transforms the map so that it shows the travel time to other stations from the station of interest.
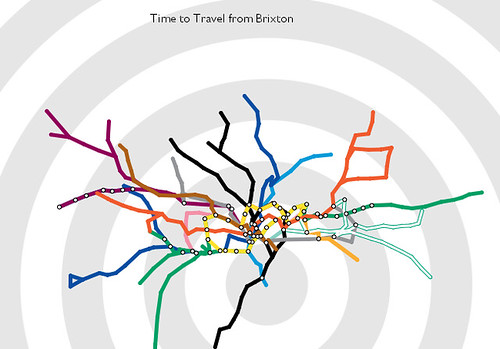
Try the interactive travel time tube map. What different sorts of information does this map convey?
No comments:
Post a Comment