An increasing number of audio recordings produced for education, as well as government, have transcripts made available for them, often as a requirement to make the materials accessible (in the sense of disability access). But what is the best way of using transcripts to enhance the delivery of audio/visual content?
The MIT Lecture Browser provides a way of searching for MIT lectures and then viewing the recordings alongside a synchronised transcript that highlights each word as it is said.
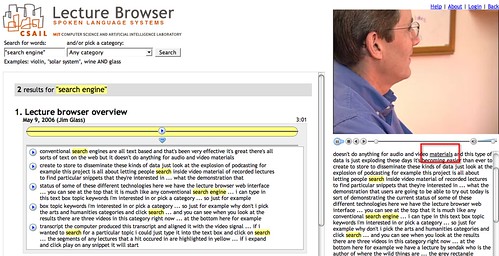
The search tool also identifies all the sections of the lecture that contain the search term and allows you to view the appropriate part of the transcript, as well as being able to start playing the video at that point in the lecture.
The search terms are located within the chunked (by speaker) visual representation of the transcript by the little horizontal black lines (which are reminiscent of word underlines). Hovering a mouse cursor over any block pops up a transcript of what was being said 'in' that block.
Use the MIT lecture browser to find one or more lectures on a topic that is of interest to you. To what extent do the visual cues in the search results (for example, identifying where in the transcript a search term appears) allow you to judge whether you want to listen to a lecture in full, or just visit one or two key parts of it?
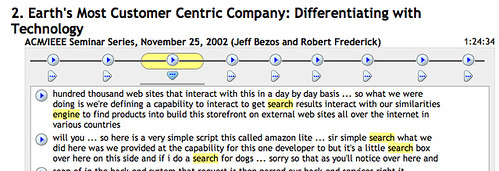
In November 2007, the New York Times published an interactive visualisation of a Republican Party Debate: Republican Debate: Analyzing the Details. The visual interface contained two parts: a transcript of the video, that played along with the video; and a 'transcript analyser' that visualised the debate in terms of contributions from each speaker (that is, when they were speaking, and also what they were speaking about). A search tool with the transcript analyzer also allows you to visualise when a particular word was mentioned throughout the debate as a whole, and the amount of time spent talking about that topic:
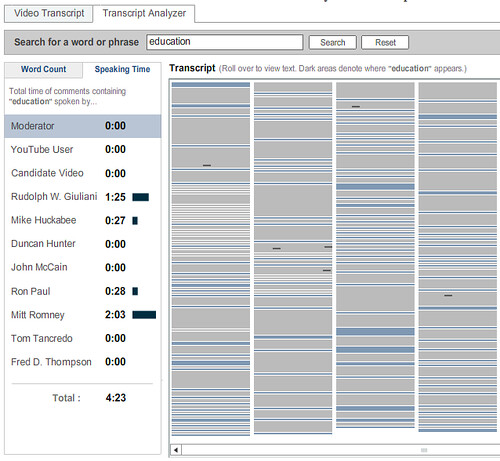
Who spoke longest on the topic of education. By using the Republican Debate: Analyzing the Details visualisation, how many times did each speaker mention the word 'education'? Who spoke most about "policy"? What "policy" were they talking about? How easy would it have been to find references to "policy" in the video transcript view? How easy is it to find those references in the video having had access to the transcript analyzer?
What are the similarities and differences between the MIT Lecture Browser and the New York Times Debate Analysis/transcript viewer tools?
(You can hear the devlopers of the New York Times debate analyser/transcript viewer talk about it's evolution here: Jon Udell's Interviews with Innovators: "Enhancing Online News Content", Shan Carter & Gabriel Dance, Graphics Editor & Senior Multimedia Producer, New York Times.)
Another approach to transcript visualisation is offered as part of the meeting analysis tools that are provided as part of the Open University's online flashmeeting video meeting/conferencing application, which augments free online video conferencing with instant messenging/chat tools, voting tools and a 'my hand's up, I want to talk next' tool.

The creators of the tool claim that "We can also visualise the shape of a meeting linearly or as a polar area diagram, showing the type of meeting and the participant roles. Due to different communication patterns in different kinds of meetings, we have observed a range of meeting event types, such as peer-to-peer or moderated project meetings, interviews, seminars, web-casts and video lectures. Also, different attendee roles can be observed, such as peers, moderators or leaders and lurkers."
This is one area where graphical tools become particularly powerful as visualisation tools. That is, they help us visually recognise (that is, literally 'see') structure that is otherwise implicitly hidden within an activity.
Read this short article by the flashmeeting team on Meeting visualisations. Severa; 'meeting dominance' charts are mentioned in the article. How do these differ visually for the various meeting types (interview, seminar, moderated meeting, and so on)? To what extent does each meeting type seem have its own unique visual signature? That is, given a dominance chart, do you think you could identify which meeting type it referred to?
The final audio/visual transcript tool I'd like to consider is the Video speed matching tool from MySociety. This tool has been designed to allow website visitors to help align UK Parliamentary transcripts from Hansard with video footage of UK Parliament debates.
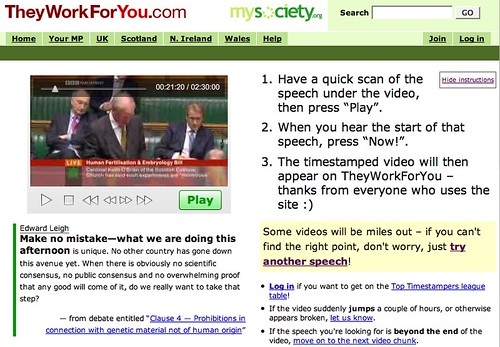
Visit the Video speed matching tool and match one or two of the videos to the transcript. How might "They Work For You" be able to use the data you have collected for them to provide a visualisation tool for UK Parliamentary debates? Is there any other "data" you could easily collect that could provide further visualisation opportunities (and what might those opportunities be?)
3 comments:
It seems that there are quite a few 'public' flashmeeting recordings available on the web, and that it is possible to use the flashmeeting analysis tools to explore them: public flashmeetings.
Well worth a look...
A demo at the BBC Mashed 2008 event showed an automatic visualisation technique for audio files (presumably based on frequency or harmonic analysis?) that allows you to identify different features within a program, such as whether music is being played, whether a male or female speaker is talking, and so on (example visulisation).
You can find out more at in the following post from the BBC R & D team: Audio Visualisation
Google have just released a gadget/widget ('In their own words': political videos meet Google speech-to-text technology) that uses automatic speech recognition to transcribe videos from YouTube's Politicians channels from speech to text.
The text is then indexed by Google's search engine and can be searched over, alongside the video titles and descriptions.
Search results into the text transcript also offer deep linking directly to the appropriate part of the video, and the location of the results are highlighted on the audio track slider.
Post a Comment